ホモクリニック軌道とヘテロクリニック軌道
定義1
ホモクリニック
ある固定点 $x_{0}$ に対して次を満たす $\phi$ を ホモクリニック軌道homoclinic orbit と呼ぶ。 $$ \lim_{t \to \pm \infty} \phi ( t , x ) = x_{0} $$
ヘテロクリニック
ある2つの固定点 $x_{1} \ne x_{2}$ に対して次を満たす $\phi$ を ヘテロクリニック軌道heteroclinic orbit と呼ぶ。 $$ \begin{align*} \lim_{t \to - \infty} \phi ( t , x ) =& x_{1} \\ \lim_{t \to + \infty} \phi ( t , x ) =& x_{2} \end{align*} $$
説明
名前の通り、ホモクリニック軌道は時間が前に流れても後ろに流れても同じ固定点に向かっていくので、ホモhomoという接頭辞が付き、ヘテロクリニック軌道は他の固定点に向かうので、ヘテロheteroという接頭辞が付く。

定義で直接的に言及していないが、ホモクリニック軌道は $x_{0}$ に向かいながらも出る経路があるため、サドルとなり、ヘテロクリニック軌道は出る側が $x_{1}$ の視点で見ると不安定マニホールドで、入る側が $x_{2}$ の視点で見ると安定マニホールド になる必要がある。
視覚化
ヘテロクリニック軌道は単に1点から別の1点に流れるイメージなので想像しやすいが、閉曲線でありサドルを含むホモクリニック軌道を直感的に思い浮かべるのは簡単ではない。
$$ \begin{align*} \dot{x} =& \sigma_{1} x + y \\ \dot{y} =& \left( \sigma_{2} - \sigma_{1} \right) y + \alpha x^{2} - \zeta xy \end{align*} $$
例として、上記のシステムで $\sigma_{1} = \alpha = \zeta = 1$ 及び $\sigma_{2} \approx -0.755$ としたとき、システムで現れるホモクリニック軌道のみを視覚化してみよう2 3。

軌道内部の初期点からフローを動画として描くと次のようになる。
コード
次はこの記事で使用されたデータを生成する Julia コードだ。
using Plots, LinearAlgebra
μ = -1.755
h = 0.1

f(v) = [v[1] + v[2], μ*v[2] + v[1]^2 - v[1]*v[2]]
pos = Base.product(-1.5:h:.5, -.5:h:2)
dir = f.(pos) ./ 10norm.(f.(pos))

v_ = [[-0.5,0.5]]
for _ in 1:500000
    push!(v_, v_[end] + 0.0001f(v_[end]))
end
truncated_v_ = v_[340000:460000]

p1 = quiver(first.(pos), last.(pos), quiver = (first.(dir), last.(dir)),
xlabel = "x", ylabel = "y", color = :gray, size = [600, 600])
p1 = plot(p1, first.(truncated_v_[1:60000]), last.(truncated_v_[1:60000]), color = :black, lw = 2, label = "orbit", arrow = true)
p1 = plot(p1, first.(truncated_v_[60001:80000]), last.(truncated_v_[60001:80000]), color = :black, lw = 2, label = :none, arrow = true)
p1 = plot(p1, first.(truncated_v_[80001:90000]), last.(truncated_v_[80001:90000]), color = :black, lw = 2, label = :none, arrow = true)
p1 = plot(p1, first.(truncated_v_[90001:120000]), last.(truncated_v_[90001:120000]), color = :black, lw = 2, label = :none, arrow = true)
p1 = scatter(p1, [0], [0], color = :black, label = "saddle node", shape = :rect)
png(p1, "saddle_orbit.png")
anim = @animate for tk in 1:1000:460001
    plot(p1, first.(v_[1:100:tk]), last.(v_[1:100:tk]), lw = 1, color = :blue, label = :none, arrow = true)
end
mp4(anim, "saddle_orbit.mp4", fps = 30)
関連記事
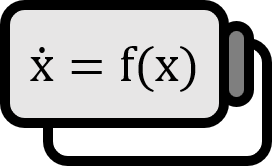
Kuznetsov. (1998). Elements of Applied Bifurcation Theory: p59. 空間 $X$ と 関数 $f : X \to X$ について、次のような ベクトル場 が 微分方程式 で与えられているとする。 $$ \dot{x} = f(x) $$ このシステムの1つの フロー を $\phi (t, x)$ のように表す。 ↩︎
Wu. (2000). Homoclinic Bifurcation in an SIQR Model for Childhood Diseases: https://doi.org/10.1006/jdeq.2000.3882 ↩︎
