
Normality of Residuals Checked by Model Diagnostics
Diagnostic Method
With the standardized residual plot, one can check whether the regression analysis was done properly.
Normality is better checked with a histogram or a normality test than by looking at how the residuals are scattered.
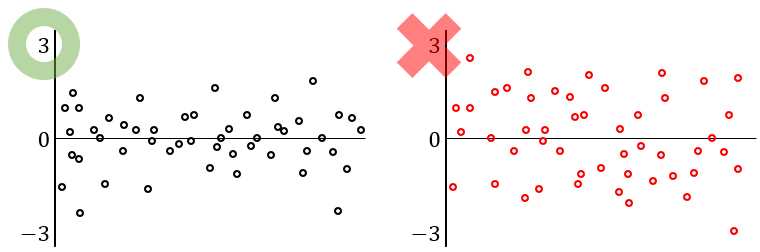 On the left, the density decreases as you move up and down from the center, whereas on the right, the points are spread evenly regardless of being above or below.
However, cases where the residuals truly follow a known distribution other than the normal distribution are almost never seen in actual analysis. When normality becomes a problem in an analysis, it is usually because of outliers.
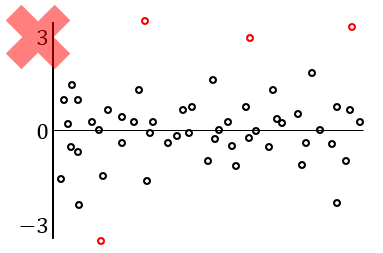
As in the figure above, normality problems arise when there are excessively many outliers relative to the sample, or when absurd values approaching 6~7 appear. Such outliers are not something to be removed recklessly; the analyst must examine the data one by one and understand them properly.