
Symbols Used When Plotting Graphs in R
Code
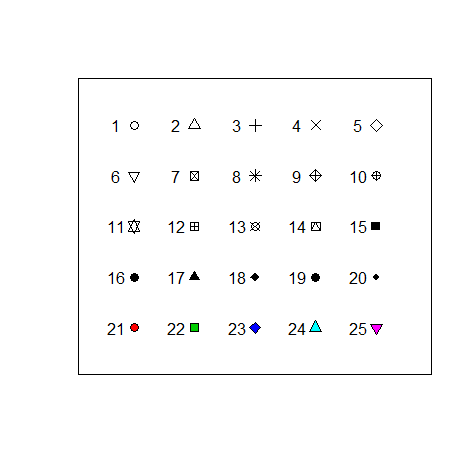
In various graph-related functions, the pch option is used to change the shape of the plotted points. The figure above displays the most frequently used symbols at a glance. There are many useful ones, but number 16 in particular is used often, and although the marks themselves are defined beyond number 25, none of them are particularly useful. You can check this by changing sym from 26 to 50 in the example code below. Meanwhile, for numbers 21 through 25, a color can be filled in via the bg option.
win.graph()
X1 <- rep(1:5, 5)
Y1 <- rep(5:1, each = 5)
sym <- 1:25
plot(X1, Y1, pch = sym, cex = 1.2, xlab = "", ylab = "",
     xaxt = "n", yaxt = "n", xlim = c(0.3, 5.7), ylim = c(0.3, 5.7))
text(x = X1 - 0.3, y = Y1, labels = sym)