
Generalized Mean
Definition1
For a nonzero real number $p$ and $n$ positive numbers $x_{1}, \dots, x_{n}$, the following value is called their generalized mean, or power mean.
$$ M_{p}(x_{1}, \dots, x_{n}) := \left( \frac{1}{n} \sum_{i=1}^{n} x_{i}^{p} \right)^{1/p} $$
For $p = 0$ and $p = \pm\infty$, it is defined by limits.
$$ M_{0} := \lim_{p \to 0} M_{p}, \qquad M_{\pm\infty} := \lim_{p \to \pm\infty} M_{p} $$
Explanation
The generalized mean is a general definition of a mean that includes the arithmetic mean, the geometric mean, and so on. It is "the arithmetic mean of the $p$th powers of the values, brought back by taking the $1/p$th power", and depending on how one chooses $p$, all of the familiar means are obtained as in the table below.
| Name | Exponent | Value |
|---|---|---|
| Minimum | $p = -\infty$ | $\min (x_{1}, \dots, x_{n})$ |
| Harmonic mean | $p = -1$ | $n \left( \sum_{i=1}^{n} x_{i}^{-1} \right)^{-1}$ |
| Geometric mean | $p = 0$ | $\sqrt[n]{x_{1} x_{2} \cdots x_{n}}$ |
| Arithmetic mean | $p = 1$ | $\frac{1}{n} \sum_{i=1}^{n} x_{i}$ |
| root mean square (RMS) | $p = 2$ | $\sqrt{\frac{1}{n} \sum_{i=1}^{n} x_{i}^{2}}$ |
| Maximum | $p = \infty$ | $\max (x_{1}, \dots, x_{n})$ |
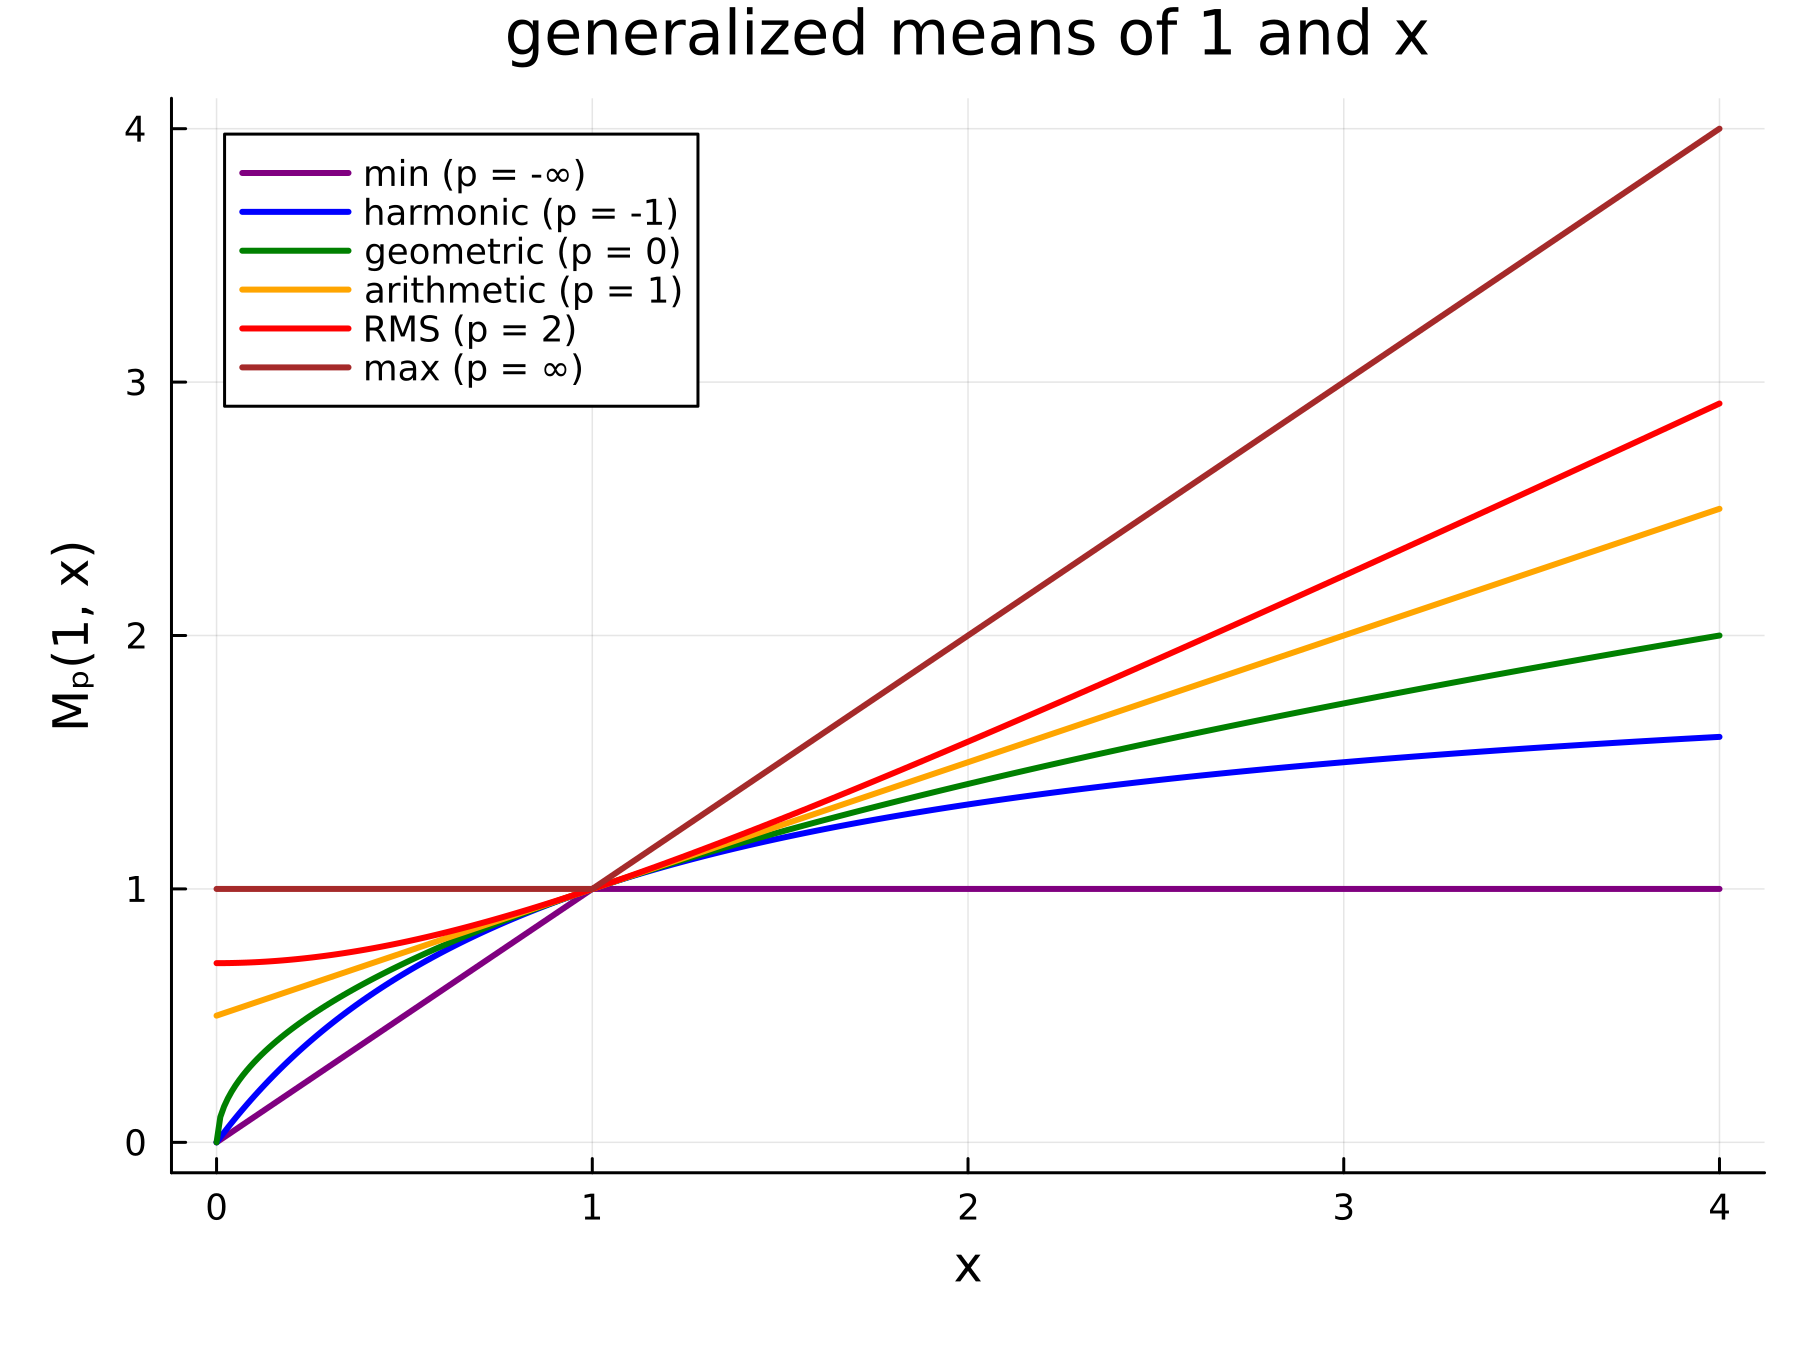
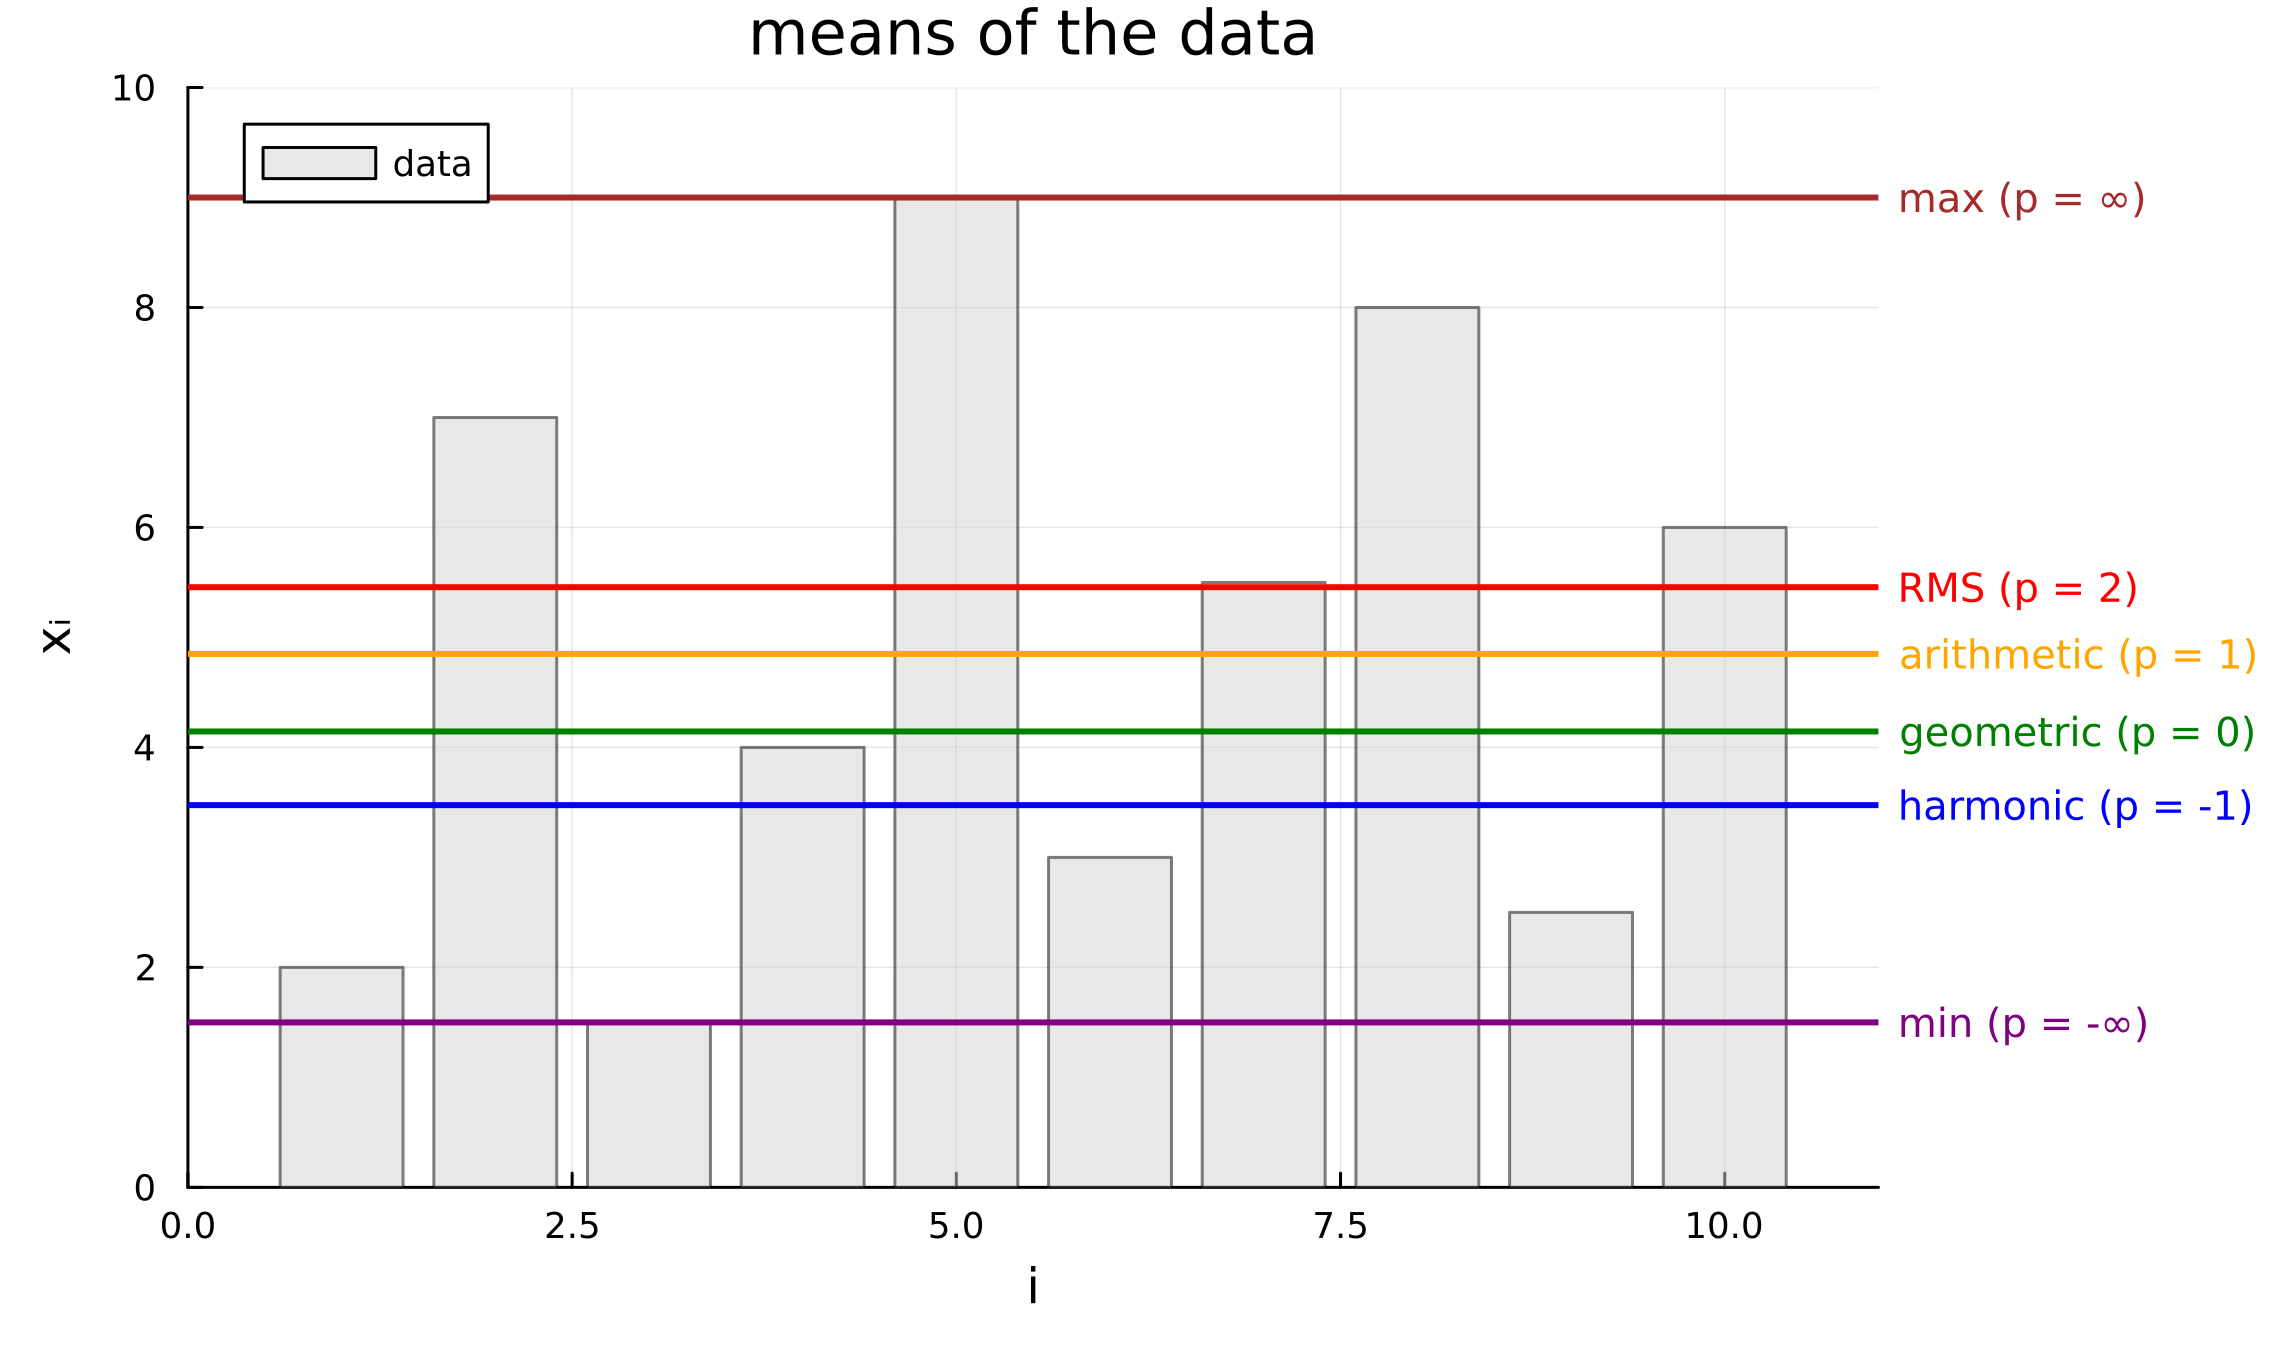
As the exponent $p$ grows, the larger values dominate the sum $\sum x_{i}^{p}$, so $M_{p}$ is pulled toward the larger values; conversely, as $p$ decreases, it is pulled toward the smaller values. And the two extremes are the maximum ($p = \infty$) and the minimum ($p = -\infty$), respectively. In fact, if the data is fixed and $M_{p}$ is regarded as a function of $p$, it is continuous and monotonically increasing, which is called the power mean inequality.
$$ p \le q \implies M_{p} \le M_{q} $$
Here, the special cases $p = -1, 0, 1$ give the well-known inequality among the arithmetic, geometric, and harmonic means, $M_{-1} \le M_{0} \le M_{1}$.
The figure below plots the generalized mean $M_{p}(1, x)$ of the two numbers $1$ and $x$ as a function of $x$. As the power mean inequality states, at any $x$ the curve with the larger $p$ lies above, so one can see the curves arranged in order from the minimum ($p = -\infty$) at the bottom to the maximum ($p = \infty$) at the top.
The next figure draws a data set consisting of $10$ values as a bar chart, with the p-means for representative $p$ shown as horizontal lines.
Properties
The following properties are presented without proof.
(a) As $p \to 0$, it converges to the geometric mean.
$$ \lim_{p \to 0} M_{p} = \sqrt[n]{x_{1} x_{2} \cdots x_{n}} $$
(b) As $p \to \infty$, it converges to the maximum.
$$ \lim_{p \to \infty} M_{p} = \max (x_{1}, \dots, x_{n}) $$
(c) As $p \to -\infty$, it converges to the minimum.
$$ \lim_{p \to -\infty} M_{p} = \min (x_{1}, \dots, x_{n}) $$
(d) The p-mean always lies between the minimum and the maximum.
$$ \min (x_{1}, \dots, x_{n}) \le M_{p}(x_{1}, \dots, x_{n}) \le \max (x_{1}, \dots, x_{n}) $$
(e) For a positive number $b > 0$, it has homogeneity.
$$ M_{p}(b x_{1}, \dots, b x_{n}) = b \cdot M_{p}(x_{1}, \dots, x_{n}) $$