How to Adjust the Camera Position of a 3D Plot in Julia
Explanation
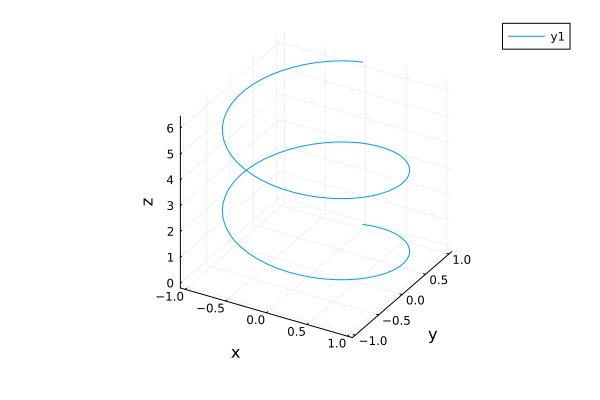
Unlike two-dimensional plots such as line graphs and heatmaps, a plot drawn in three-dimensional space looks different depending on the direction from which it is viewed. The viewpoint of a 3D plot can be set using the camera=(azimuth, altitude) option. azimuth denotes the azimuth angle, representing the angle from the $xz$-plane. altitude denotes the altitude, representing the angle from the $xy$-plane. The default value is camera=(30, 30). Drawing a spiral gives the following.
using Plots

θ = range(0, 2π, length=100)
x = sin.(2θ)
y = cos.(2θ)
z = θ

plot(x, y, z, xlabel="x", ylabel="y", zlabel="z")
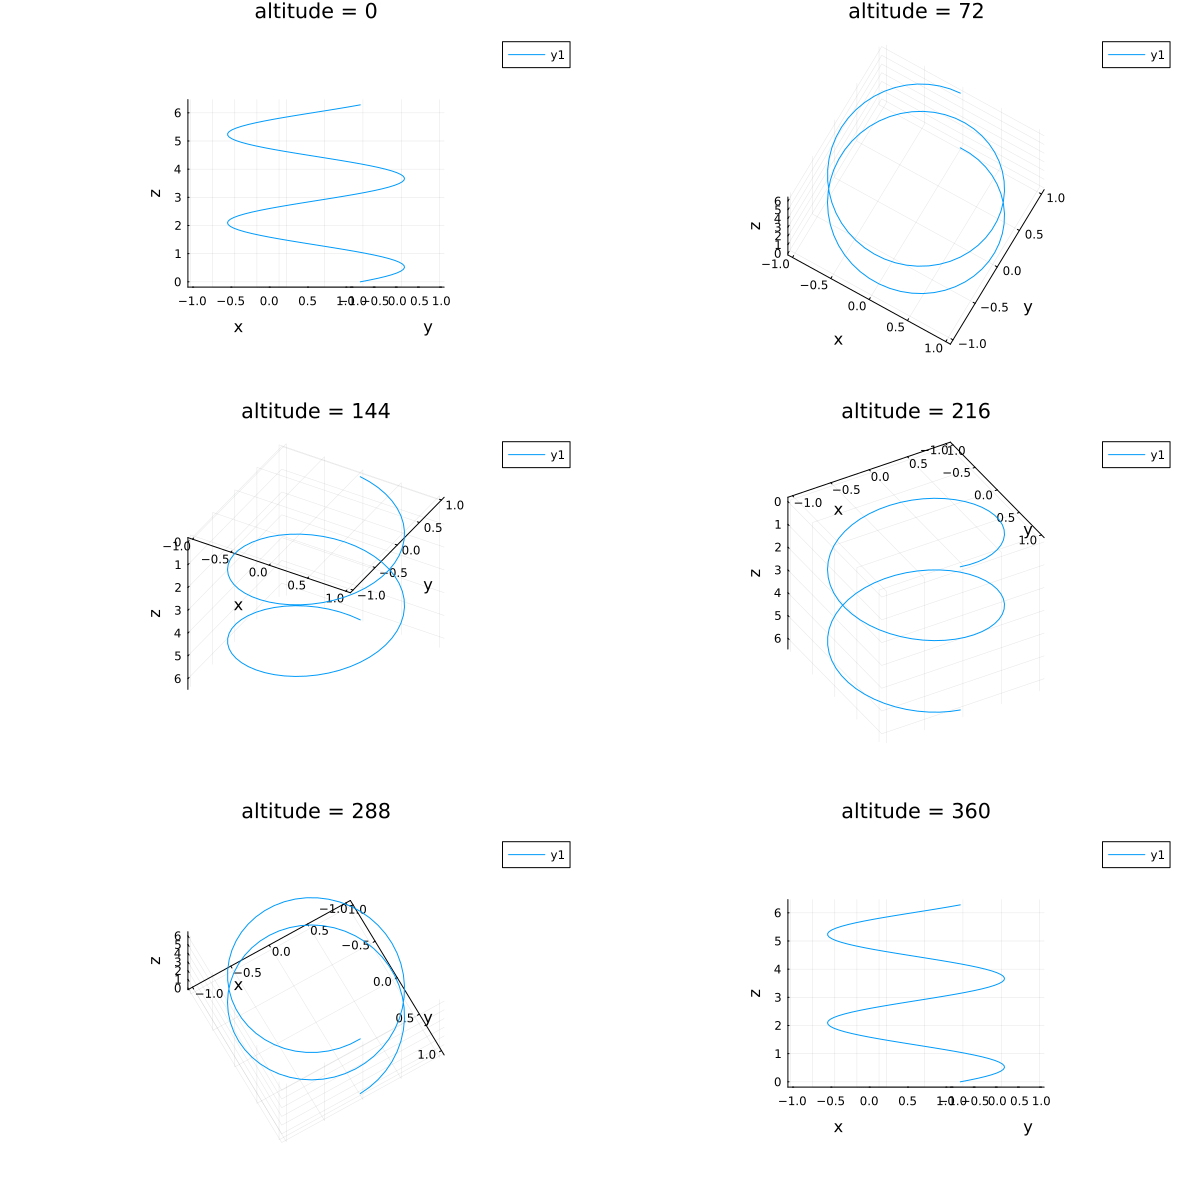
Changing the altitude from 0 degrees to 360 degrees in this plot,
anim = @animate for i ∈ 0:2:180
    plot(x, y, z, xlabel="x", ylabel="y", zlabel="z", camera=(30,i), title="altitude = $i")
end
gif(anim)
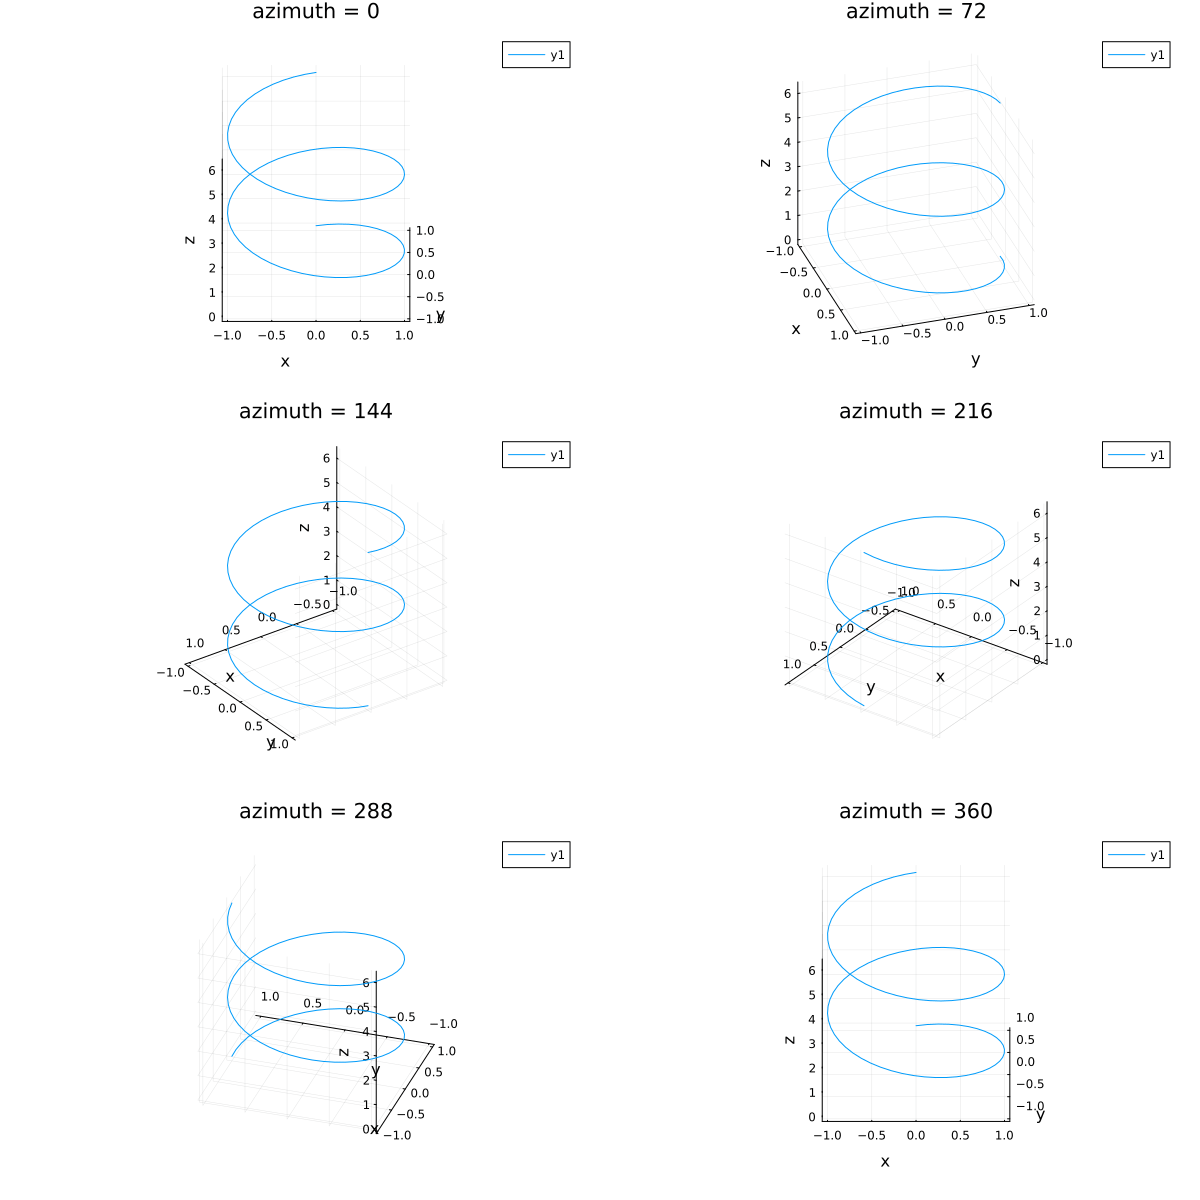
Changing the azimuth,
anim = @animate for i ∈ 0:2:360
    plot(x, y, z, xlabel="x", ylabel="y", zlabel="z", camera=(i,30), title="azimuth = $i")
end