A Metric for Comparing Attractors: Deviation Value
Definition1
Given two attractors $A$ and $\widehat{A}$ over a certain period of time, the deviation value $DV$ is defined as follows. $$ DV = \sum_{i,j} \left| f_{ij} - \hat{f}_{ij} \right| $$ Here, $f_{ij}$ and $\hat{f}_{ij}$ denote the relative frequency with which $A$ and $\widehat{A}$, respectively, were located in the $(i,j)$-th cell.
Explanation
Simply put, a cell is one of the grid squares obtained by choosing two axes in which $A$ lives, representing it on that plane, and dividing the plane into a grid.
Fundamentally, $DV$ is the mean absolute error (MAE). For attractors, especially chaotic ones but even periodic ones, one cannot say that they pass through the same point at a given moment. Accordingly, $DV$ can be regarded as a metric that evaluates not whether the dynamics agree moment by moment, but whether they exhibit the same dynamics in the long run.
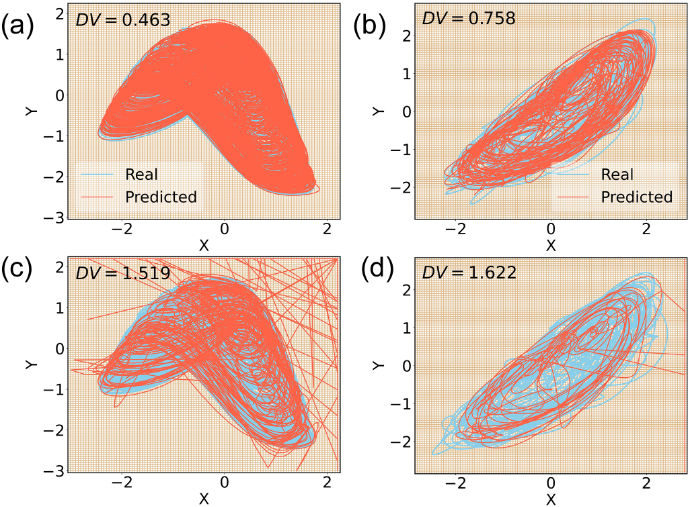
In the figure above, there is the actual attractor shown in sky blue and the predicted attractor shown in orange, and one can see that the larger the discrepancy between them, the higher $DV$ is.
Zhai, Z. M., Kong, L. W., & Lai, Y. C. (2023). Emergence of a resonance in machine learning. Physical Review Research, 5(3), 033127. https://doi.org/10.1103/PhysRevResearch.5.033127 ↩︎