
How to Add Shaded Intervals to Plots in Julia
Code
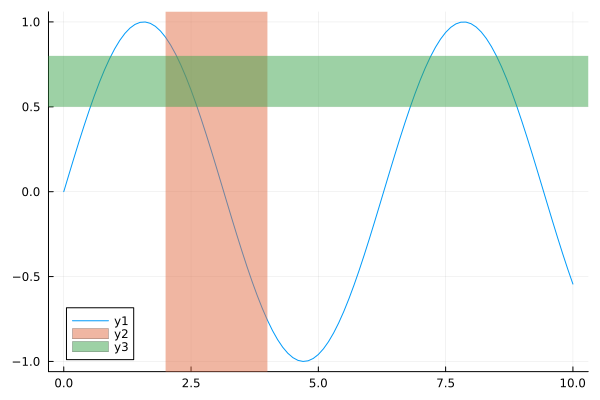
You can add shaded intervals to a plot using the vspan! and hspan! functions. vspan! adds shading along the x-axis direction, and hspan! adds shading along the y-axis direction. This is especially useful for marking time periods in data such as time series data.
using Plots

x = 0:0.1:10
y = sin.(x)

plot(x, y)
vspan!([2, 4], alpha=0.5)
hspan!([0.5, 0.8], alpha=0.5)