
How to Set Subplot Layouts in MATLAB
Code
In the past, subplot was used in MATLAB to place multiple panels in a single figure, but nowadays using tiledlayout and nexttile is recommended.
tiledlayout
fig = tiledlayout(2, 2);
tiledlayout(m, n) creates a layout that divides the figure into m rows and n columns in which panels can be placed.
nexttile
nexttile
plot(-pi:0.01:pi, sin(-pi:0.01:pi))

nexttile
plot(-pi:0.01:pi, cos(-pi:0.01:pi))

nexttile([1, 2])
plot(-(pi/4):0.01:(pi/4), tan(-(pi/4):0.01:(pi/4)))
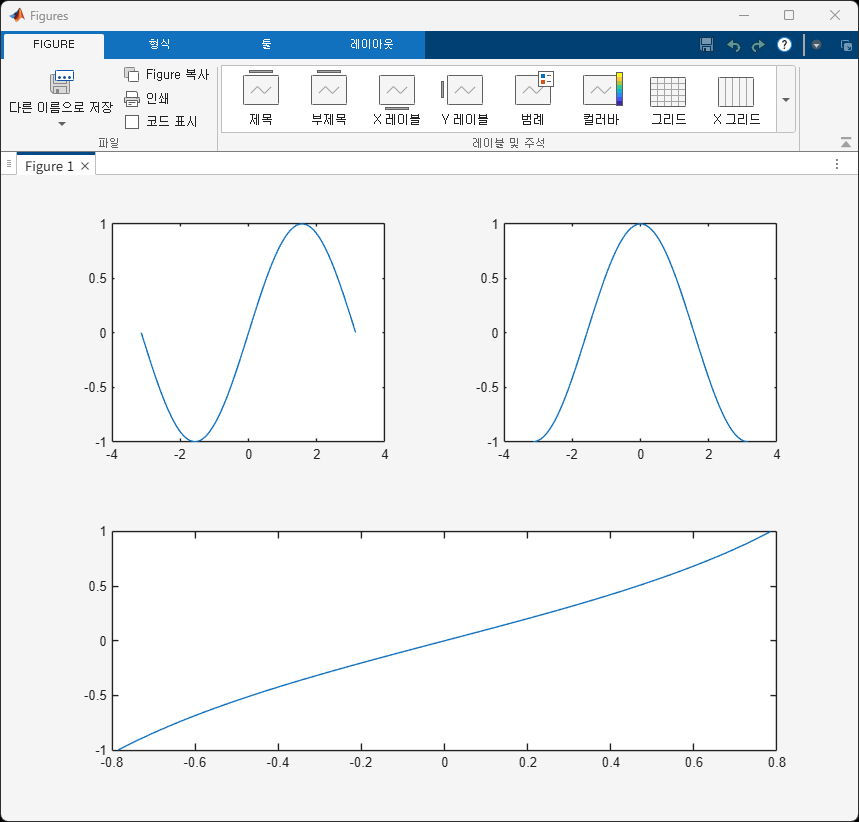
nexttile is a command that moves on to the next tile; when used in functional form with a tile size as input, it occupies the corresponding number of tiles. The result of running the code so far is as follows.
Complete Code
fig = tiledlayout(2, 2);

nexttile
plot(-pi:0.01:pi, sin(-pi:0.01:pi))

nexttile
plot(-pi:0.01:pi, cos(-pi:0.01:pi))

nexttile([1, 2])
plot(-(pi/4):0.01:(pi/4), tan(-(pi/4):0.01:(pi/4)))