
How to Invert Axis Direction or Tick Direction in Julia Plots
Code
$$ A = \begin{bmatrix} 1 & 5 & 9 & 13 \\ 2 & 6 & 10 & 14 \\ 3 & 7 & 11 & 15 \\ 4 & 8 & 12 & 16 \end{bmatrix} $$
A = reshape(1:16, 4, 4)
heatmap(A)
Suppose, for instance, that we are given a matrix $A$ as above. Axis inversion is usually useful when dealing with heatmaps or images, and drawing $A$ as a heatmap gives the result shown below.
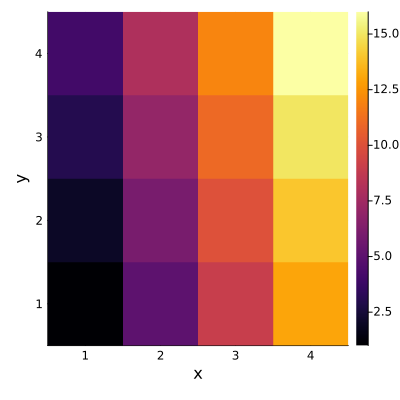
As you can see, unlike how the matrix appears, the row direction is flipped. This is not a bug but a natural result with respect to the Cartesian coordinate system; nevertheless, it becomes very confusing because we cannot view it exactly as the matrix.
flip
heatmap(A, yflip = true)
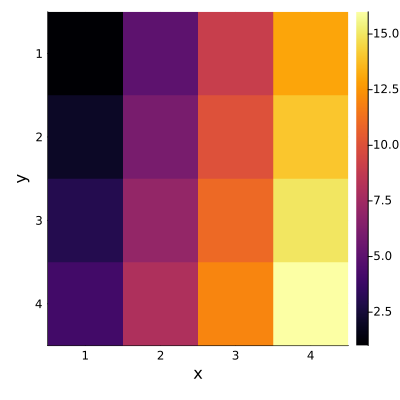
Giving the yflip = true option as above inverts the y-axis direction so that it appears exactly like the matrix. The problem is that, unlike how we usually place the row index on the left and the column index on the top when dealing with matrices, the x-axis ticks are still located at the bottom.
mirror
heatmap(A, yflip = true, xmirror = true)
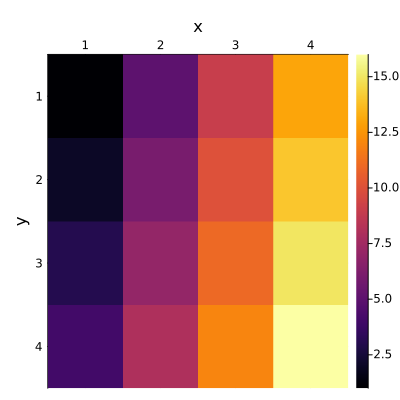
Adding the xmirror = true option as above keeps the plot the same while moving only the x-axis ticks to the top.
Complete Code
using Plots

default(size = [400, 400], xlabel = "x", ylabel = "y")
A = reshape(1:16, 4, 4)
heatmap(A)
heatmap(A, yflip = true)
heatmap(A, yflip = true, xmirror = true)