
How to Write Different Content on Julia Plot Axes Ticks than Actual Values
Overview
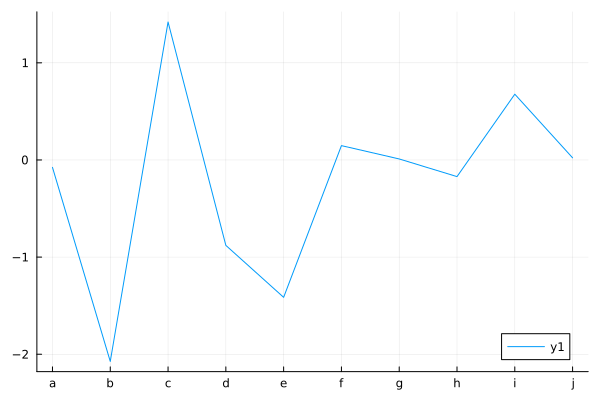
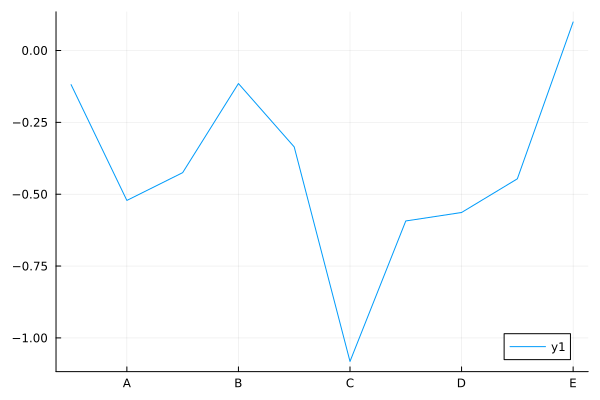
When drawing a plot in Julia, there are times when you want to write content on the axis ticks that differs from the actual values. This is especially true when dealing with categorical data, in which case you can pass ticks as a keyword to plot, bundling the actual positions and the content to be displayed into a tuple.
Code
using Plots

plot(randn(10), xticks = (1:10, 'a':'j'))
plot(randn(10), xticks = (2:2:10, 'A':'E'))