
Drawing Graphs in R
Overview
R has the advantage that, compared to other languages, expressing graphs is very easy.
Compared to other statistical packages, for simple plots a package may be faster, but as fine-grained expressions increase, R tends to become more convenient.
Of course, R is not necessarily a language solely for graphics, but since this is a very big advantage, it is good to practice until you can handle it freely.
Code
set.seed(150421)
x<-1:10
y<-rnorm(10,5)
z<-rexp(10)

win.graph(4,4)

plot(x,y,main="주제목",sub="부제목",xlab="x-axis",ylab="y축")
win.graph(8,4)
par(mfrow=c(1,2))
plot(x,y,main="왼쪽 한 칸만 사용한 상태")
plot()
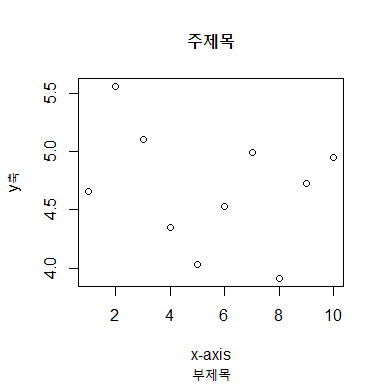
As the most basic function for drawing graphs, it takes the first argument as the $x$-axis and the second argument as the $y$-axis to draw a 2-dimensional graph. Its main options include the following:
main: takes a string and sets the main title of the graph.subadds a caption (subtitle), but there is rarely much use for it.xlab,ylab(x label, y label): take strings and set the names of the axes.xlim,ylim(x limit, y limit): take a $2$-dimensional vector and adjust the limits within which the axes are displayed.type: sets the type of the graph. By default only points are plotted, and by enteringtype='l'you can draw a line graph.asp(aspect): adjusts the scale of the $x$-axis and $y$-axis. If true, the ratio is kept the same; if false, it is determined automatically for each axis.
win.graph()

win.graph() is a function that opens a new window for drawing graphs, and is mainly used to keep the size of graphs consistent. Entering two numbers adjusts the width and height.
par(mfrow=c(1,2))
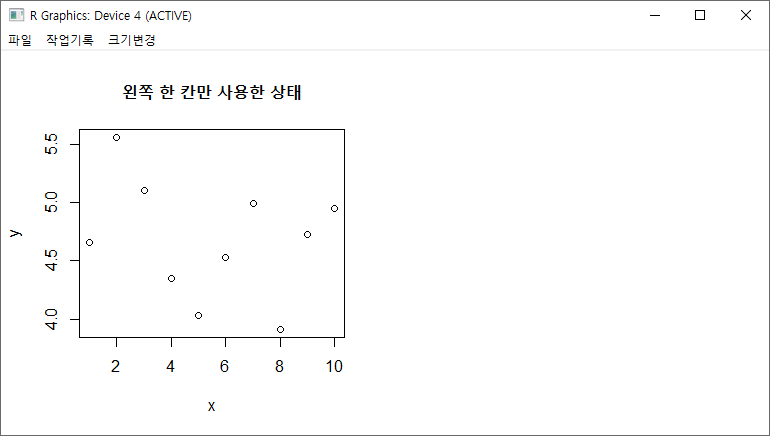
This is a function that splits the window in which graphs are drawn, and is useful when laying out several graphs side by side for comparison.
par(new=TRUE)
Functions such as plot() are drawn by completely overwriting the existing graph. There is rarely a use for it, but entering par(new=TRUE) leaves the existing graph as is and draws a new graph.